UPDATE NOTE – Since I wrote this post last night, SPX/ES has obviously broken down from the asymmetric double top there with alternate targets in the 4540 and 4515 (both SPX) areas, though so far, NDX/NQ has not yet broken down.
So far this week SPX has defied the historically bullish tape over Thanksgiving and that strong historical bullish bias extends into the close on Monday. I was leaning towards seeing at least a backtest of the 4540 SPX area after that but it looks like we may see that before.
MAIN POST –
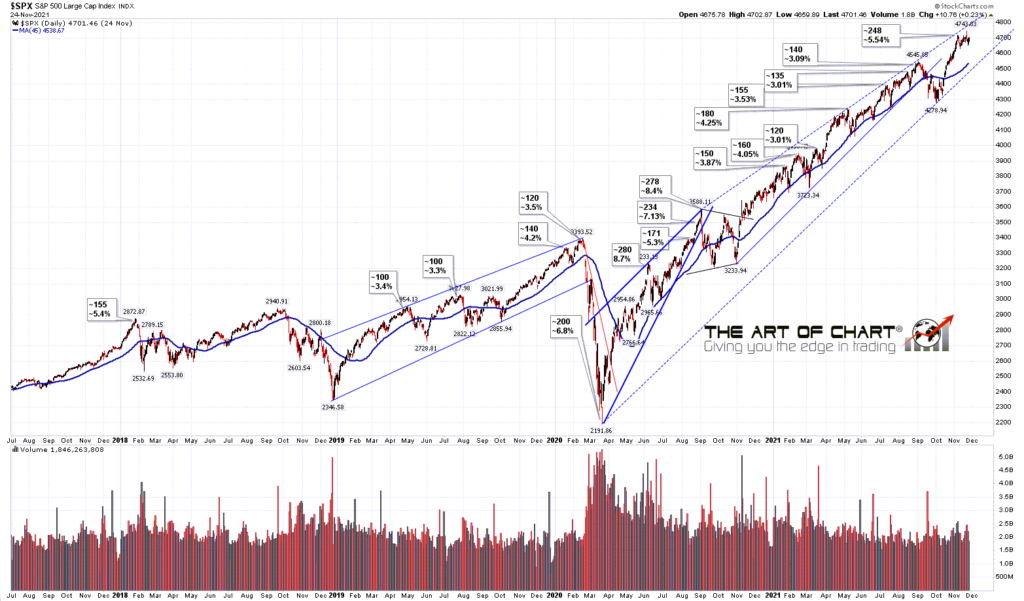
The big number on the equity index board at the moment is the high SPX made a few days ago at 5.54% over the 45dma, which closed Wednesday at 4538. SPX is likely topping out here for a reversion to mean move, and the mean I use is that 45dma, so I’m watching for a setup to take SPX back to that area.
Could a larger high be forming here? Yes, and I’d refer back again to the backtest scenario that I was looking at in my post on Friday 6th August. This could well be setting up for that backtest here and I’ll be watching the next retracement with great interest. If seen, and then followed by new all time highs, then this could fix an upside target on SPX in the 6500 area, so that might well be a bullish backtest of course.
SPX daily vs 45dma chart:
In my last post on Monday I was looking for a new all time high on SPX to add to the one already in place on NDX, and we saw that on Monday morning. That set a possible daily RSI 14 sell signal brewing on SPX, and that sell signal fixed at the close on Wednesday.
Since then SPX has defied the bullish stats this week and retraced to test the daily middle band, now at 4670, as support. If that breaks and converts to resistance then that reversion to the mean move may well be in progress.
SPX daily chart:

Is there a setup to deliver a move to that area in place? Yes, there is a decent quality double top setup formed here, shown on the 15min chart below. On a sustained break below 4630.86 the alternate double top targets would be in the 4540 or 4515 areas.
SPX 15min chart:

NDX has also been testing the daily middle band, currently at 16202, as support, and that has held so far. On a break and conversion to resistance the daily RSI 14 sell signal brewing on NDX should fix as well.
I’d note that the other two main US indices that I track, the Russell 2000 and Dow Industrials, are both considerably weaker than SPX and NDX, and are both currently holding their daily middle bands as resistance.
NDX daily chart:
Is there are setup to deliver a move lower in place on NDX? Yes, a possible H&S is forming, and a sustained break below the 16100 area would look for the 15550 area.
NDX 15min chart:
The historical stats for the Friday and Monday after Thanksgiving are impressively bullish so I’m doubtful about seeing much downside before the historically bearish last day of November on Tuesday, but that being said, the same could have been said on Monday morning, and the fast new high then died into a retracement that lasted into Wednesday.
A couple of things to mention before the weekend. Last weekend we did our monthly free public Chart Chat at theartofchart.net with a look into what we are seeing for the first six months of 2022, and if you’d like to see that you can see that here, or on our November Free Webinars page.
On Wednesday we did our monthly free public Big 5 & Key Sectors webinar at theartofchart.net, and if you’d like to see that you can see that here, or on our November Free Webinars page.
We are also running our annual Black Friday and Cyber Monday sale with deep discounts on annual memberships at theartofchart.net, and if you are interested you can find out more about that here.
Everyone have a great holiday weekend 🙂
 26th Nov 2021