In my last post I was talking about an SPX target in the 4500 area as long as SPX stayed under the daily middle band. Since then we saw a short lived break above the daily middle band but SPX failed to convert that back to support and has delivered a new retracement low today.
I would note the open daily RSI 14 sell signal that I am expecting to reach at least the possible near miss target at 34-6 on the RSI 14 by the end of this move.
SPX daily chart:

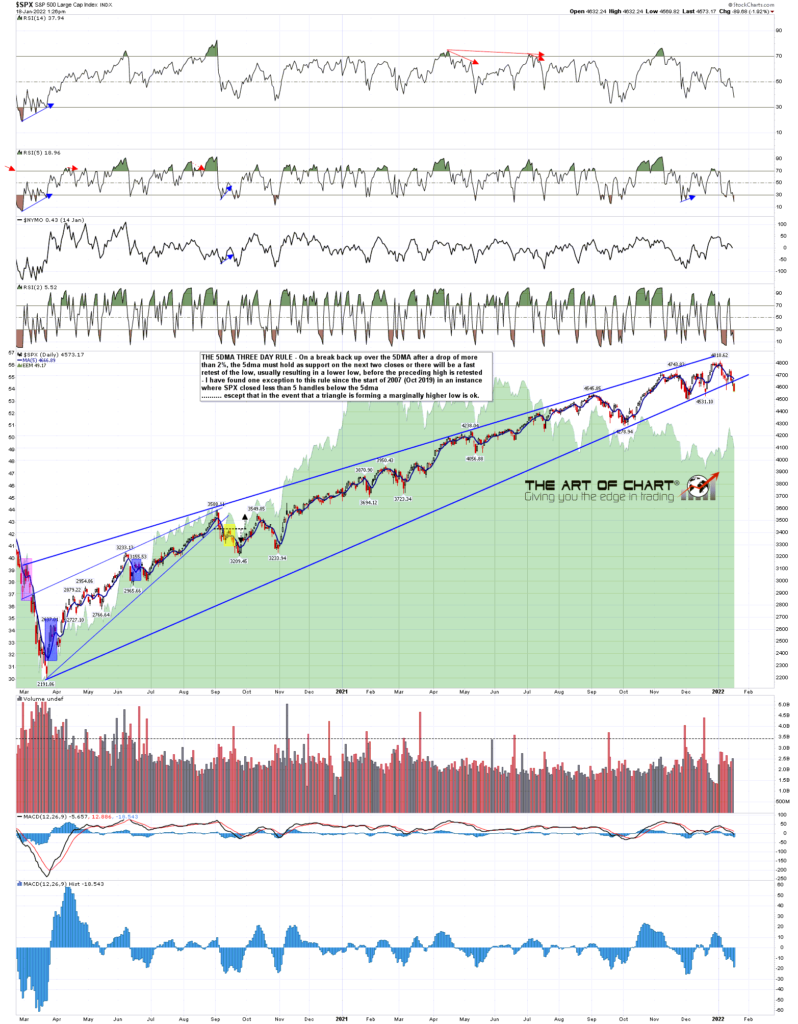
The new retracement low was signalled by one of my favorite indicators, the SPX 5dma Three Day Rule, which states that after a decline of more than 2%, if there is a break back over the 5dma, then SPX needs to hold above the 5dma for the next two closes. On a clear break back below the 5dma at the close on day two or three, there will be a (generally fast) retest of the prior low before a retest of the prior high. I’ve run this back to 2007, and with the exception of a fail in 2019 when SPX closed only two handles below the 5dma, and a couple of marginal higher lows when triangles were forming, this has delivered every time since then.
SPX daily 5dma chart:
On the hourly chart the RSI is showing no sign of a low yet, and I have marked in the obvious though as yet unconfirmed support trendline which is a decent match with the 4500 area possible H&S neckline.
SPX 60min chart:
On NDX there is also an open daily RSI 14 sell signal that I am also expecting to reach at least the possible near miss target at 34-6 on the RSI 14 by the end of this move.
NDX daily chart:
On NDX, which has not yet made a lower low, I am watching this leg of the retracement with particular interest. There is a high quality falling channel established from the last all time high and, if that holds, the obvious read would be that the channel is a bull flag channel. The possible falling wedge marked on the SPX hourly chart may also be a bull flag forming of course.
NDX 60min chart:
So what next? I’m looking for the target area on SPX to be tested in two to four days, and given that the SPX 3sd lower band is currently at 4512, I’d expect that support to hold for at least a strong rally. On SPX the target for that rally would either be for an H&S right shoulder high, ideally in the 4734 area, or if these are bull flags forming on SPX and NDX, retests of the all time highs on both, possibly to make the second highs on large double tops.
We are doing our free public Big Five and Key Sector ETFs webinar at theartofchart.net an hour after the close on Thursday, and if you would like to attend you can register for that here, or on our January Free Webinars page.
 18th Jan 2022
Nice write up Jack! Look forward to seeing how this plays out and still hoping we get to 3800 back test target