In my post on Friday 6th August last year I was looking at a possible backtest scenario on SPX that could be setting up and I reviewed how that is looking on my first post this year, as I was thinking, and am still thinking, that backtest may well be delivered over the next few weeks.
That backtest would be of a huge resistance trendline on SPX that broke at the end of 2020 / start of 2021, and is currently in the 3850 – 3900 area. The break over that trendline may have been a break up over a rising megaphone resistance trendline with a target in the mid 6000s on SPX , but if that is the case, to confirm that target, the trendline would need to be backtested and hold into new all time highs on SPX.
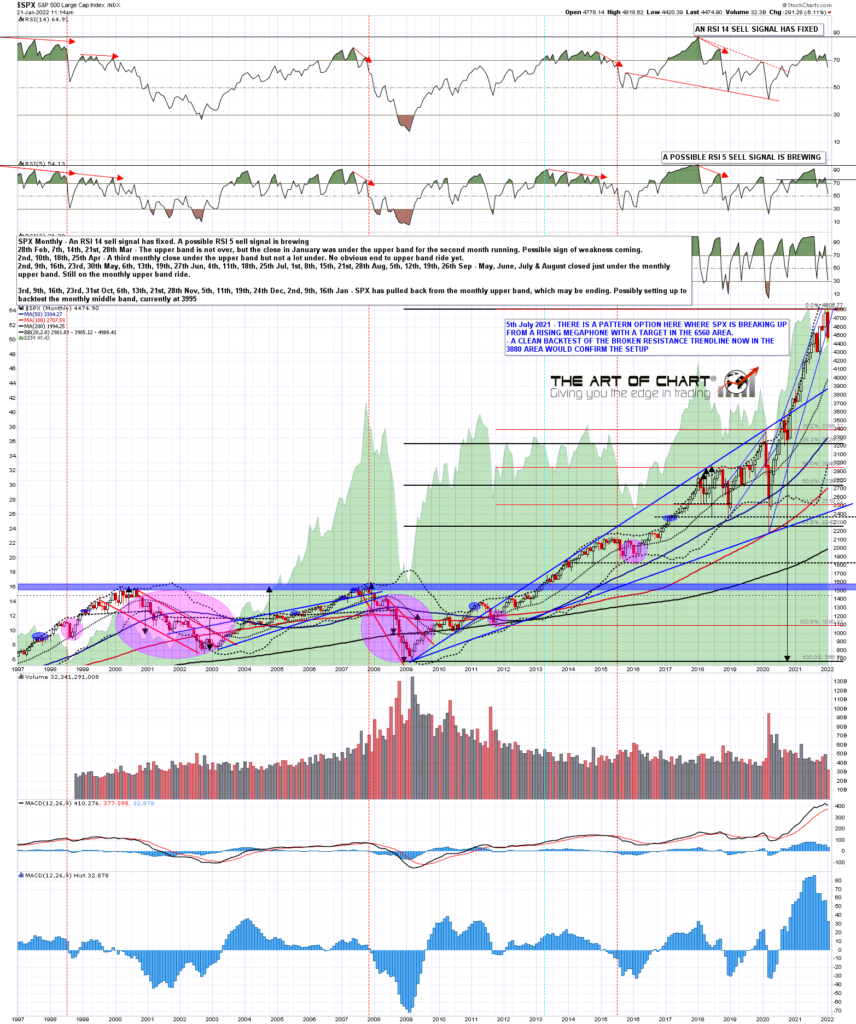
Obviously the strength of this decline so far in January has surprised most, so I’d like today to review what the decline so far is telling us, and to talk about the monthly SPX chart.
I’ve been talking about a backtest of the monthly middle band, now at 3995, which is a decent match with the backtest of the broken trendline I have been looking at, now in the 3880 area.
If you look at the chart below you can see that the monthly middle band was tested or broken every year from 1998 – 2009, when this current very strong bull market started. Since then there have been three years with very strong bull moves when the monthly middle band wasn’t tested, those being in 2013, 2017 and 2021. In the years after those the middle band was backtested in 2014, and broken hard at the end of 2018. There have been strong breaks below the monthly middle band in 2011, 2015/6, 2018 and of course 2020. Backtests of the monthly middle band usually happen in bull markets in a normal year, even in this very strong bull market from 2009, particularly in a year after it has not been backtested, like 2021.
The second thing to say here is that the backtest of the monthly middle band and broken trendline resistance could deliver a 20% decline, putting SPX into a technical bear market. That sounds alarming but in practical terms doesn’t mean much. The declines on SPX in 2011, 2015-6 and 2018 all delivered declines in the 15% to 22% range. The decline in 2011 was 21.5%, the decline in 2015-6 was 15.2%, and the decline in 2018 was 20.2%. Both of the 2011 and 2018 declines passed the 20% boundary for a technical bear market, and both ended almost immediately after doing so, so in effect all three were just strong corrections. The decline in 2020 went further, but was a crash rather than a bear market, like the one in 1987, but recovering far faster due to massive intervention by the Fed and US government.
There hasn’t been a real bear market since 2008-9, and while we could potentially see one of those here, the confirmation of that would have to be a sustained break below the 3800-4000 support range, and the conversion of that area to resistance. Until then it is just business as usual, and it is way too early to get excited about a real bear market happening here.
Is there a setup for a real bear market here? For sure. With inflation rising the Fed’s room to intervene to support markets is limited, and an activist Fed supporting the market has been the main driver for the market for years, but we have yet to see how far inflation will go, and what impact that will have on policy. We’ll see. In the short term a red close for January would be cautiously bearish for 2022, and so would the monthly RSI 5 sell signal that will likely fix at the end of January if SPX closes much under 4600. I’m watching the next few days with particular interest as we move into the end of the month.
SPX monthly chart:
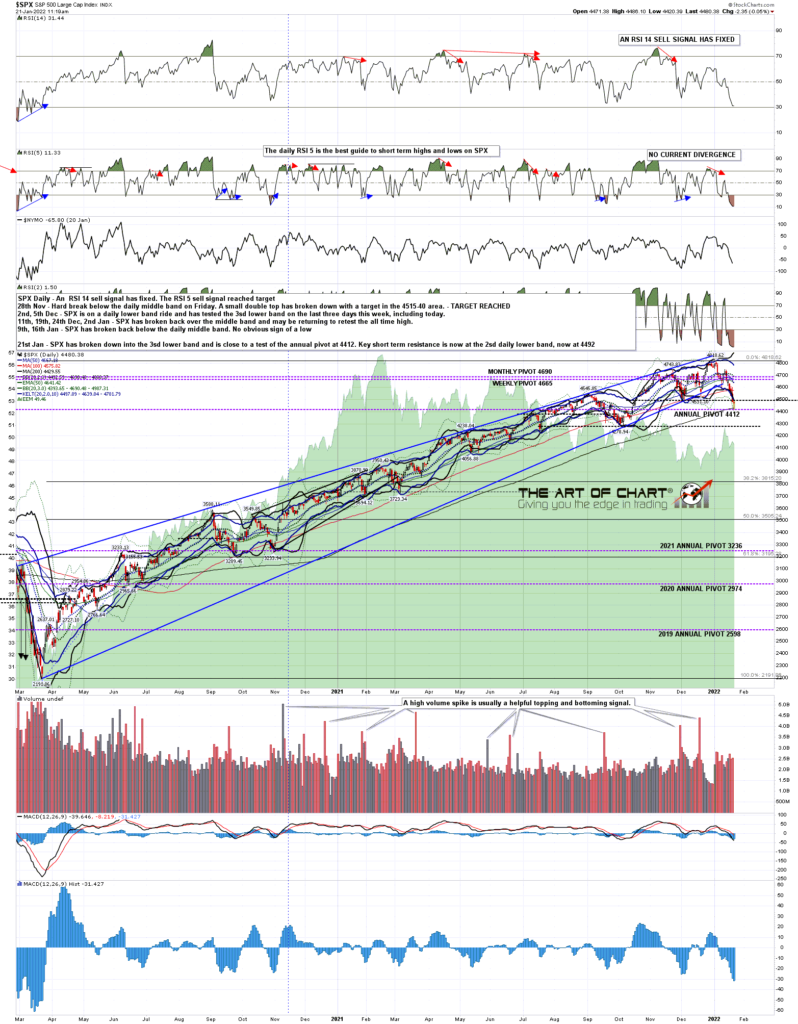
Looking at the SPX daily chart this move has broken the daily lower band and tested the 3sd lower band. That is generally a very good sign that a strong rally is imminent. There is a caveat here though. In the event that SPX has moved into the strongest kind of daily lower band ride then the decline can continue until SPX can break back over and convert the daily lower band, now in the 4492 area. Until that happens I’d expect to see the daily lower band tested as resistance every day. I would note that the rally high today was at 4494, and if that holds then SPX may be on this kind of lower band ride. If so, SPX may decline rapidly further from here until the band ride ends, though it is already fairly stretched to the downside of course.
With 4500 area support broken where is the next obvious big level? There is a much larger possible H&S neckline in the 4280 area, and that may be the next target. If that is reached I would be looking for some daily positive divergence to develop there to signal a bounce, that would require a test, a decent rally that lasted into the end of the day, and then a low retest. If seen the ideal right shoulder high would then be in the 4546 area.
SPX daily chart:
There have been a lot of broken supports over the last day. One of those was the NDX channel support that I posted on Tuesday. NDX is now close to a possible H&S neckline and very big support level that I am watching in the 14384 area. That may well hold.
NDX 60min chart:
So what might happen here if equity indices keep declining? Well we did our big 5 and key sectors review last night and two charts there particularly sprang to the eye.
On AMZN a decent quality double top has broken down with a target in the 2550 area, but as with NDX, there is possible support at a possible H&S neckline and well established support level in the 2881 area. If we are to see a strong rally soon that would be the obvious place to see that start. If an H&S was forming soon the obvious right shoulder high would be in the 3552 area.
AMZN daily chart:

On the AAPL chart a high quality double top has broken down with a target in the 152 area. That is a strong target as main rising support is there from the 2020 low, but again there is a possible larger H&S neckline in the 156-8 area:
AAPL daily chart:
What’s the bottom line here? SPX may be on a strong daily lower band ride and for that to end, SPX needs to break back over 4500 and convert that to support. If seen, the daily middle band would then be key downtrend resistance again, and that is currently at 4689.
We did our monthly free public Big Five and Key Sectors webinar at theartofchart.net yesterday and if you missed that you can see it here or on our January Free Webinars page.
 21st Jan 2022