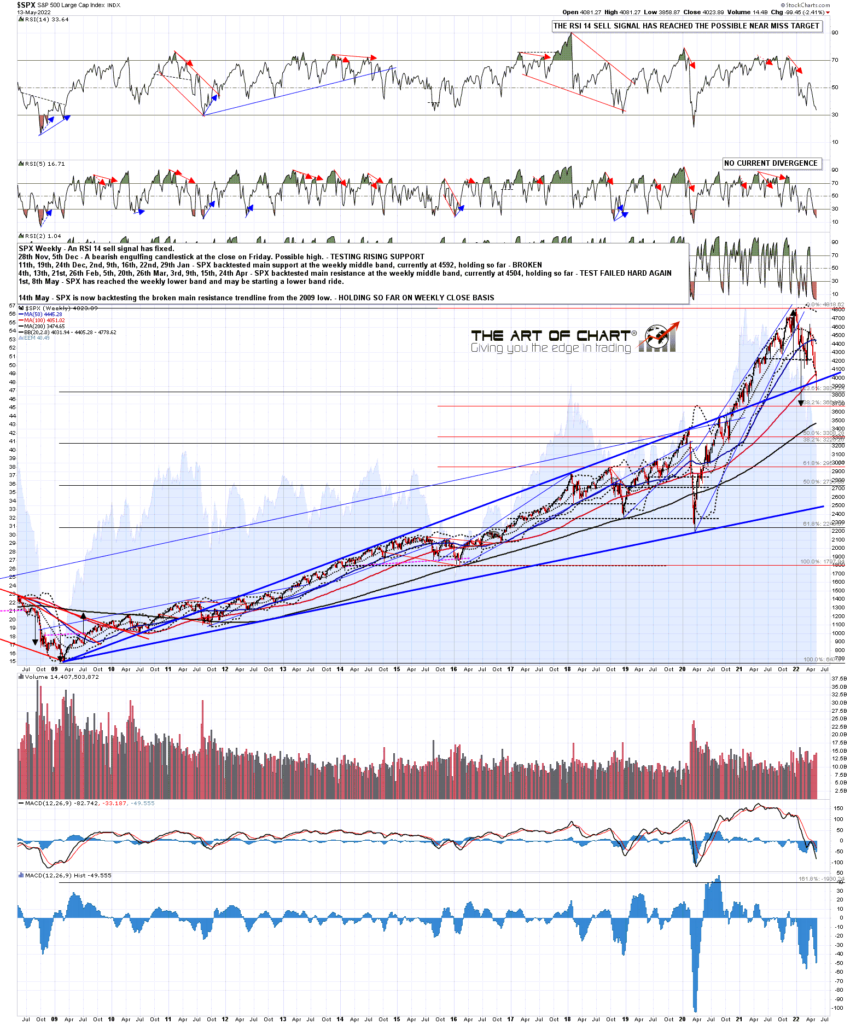
SPX rallied hard on Friday and so closed back well above my retracement target support trendline, so that has held on a weekly basis and may still hold as the retracement low here. So how is this low looking as a possible retracement low?
The first thing to say that my possible very bullish scenario that I was thinking might well be set up on this retracement is, if not dead, at best sufficiently badly damaged that the pattern target could not be relied upon even if the current all time high was next to be broken and converted. The pattern setup requires a fairly precise retest of the trendline and this didn’t meet that standard. Given the economic background that scenario was perhaps too much to look for in any case.
Does that mean this can’t be the retracement low? No, and on actually the setup that we have here the odds of that retracement low being made here are looking pretty good, having firmed up a lot in trendline terms particularly over the last two trading days.
SPX weekly chart:
One thing that doesn’t look ideal here is the amount of positive divergence on the daily charts at this low, but that could easily be fixed with a low retest that holds. That may be setting up here as SPX broke back over the 5dma on Friday, and is therefore back on the Three Day Rule. If we see a clear RTH close back below it on either Monday or Tuesday this week, we will have another fixed target at a retest of the current retracement low at 3858.87. There are other options for a reversal pattern back up from here, but some seventy percent of significant highs and lows on SPX form with a double top or bottom, and SPX may be forming an overall more serious high here.
SPX daily 5dma chart:
If we are seeing a retracement low forming here, then that brings us back to my main retracement scenario, which is that so far this year bull flags have been forming from the all time highs on pretty much everything. You can see the bull flag falling megaphone option on the chart above, on the chart below is the similar one on NDX. NDX has been leading the declines this year, and has now retraced 50% of the move up from the 2020 low. That is the most obvious level to find a retracement low.
There are already RSI 14 and RSI 5 daily buy signals fixed on NDX, so there is no need for a low retest, though we might see one anyway to set up a reversal pattern.
NDX daily chart:
I tend to use the big five and key sectors for a general barometer of where the market is and was discouraged on Wednesday night that the setup for bull flags there was unimpressive. That changed in the next two days though, and when I looked again this weekend I saw that it was now pretty solid.
On the AAPL chart below my initial flag support trendline broke, but another high quality bull flag channel support trendline was established at the last low, so there is a very decent quality bull flag there again. It is also hitting an important support level and possible H&S neckline.
That does leave a possible bear option here of course, as a right shoulder could form here with an ideal target in the 156.60 area, and I’ll be watching for that, but until this flag channel support is broken, this is a clear bull flag from the high.
AAPL daily chart:
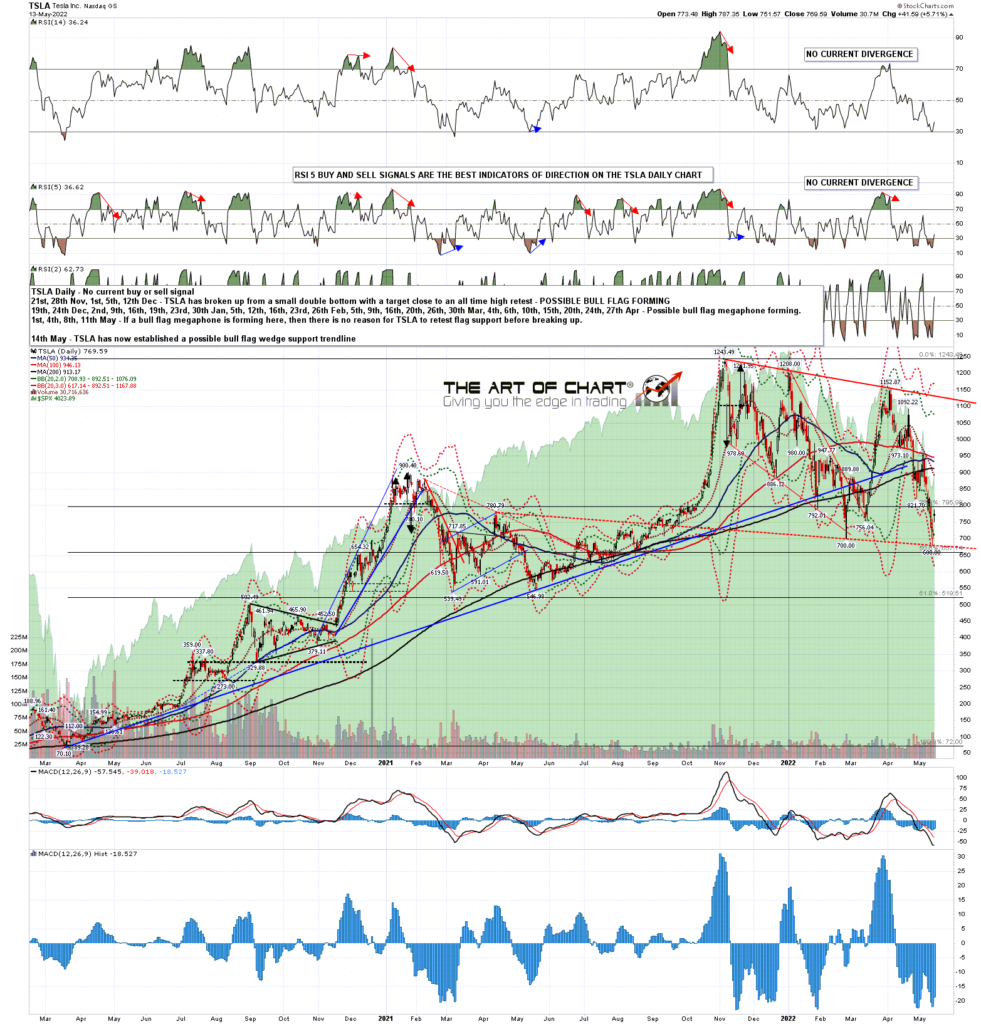
On TSLA the early April high established a beautiful three touch trendline from the all time high, which was strongly suggestive of a bull flag forming, but the support trendline was uncertain. That too was fixed at Thursday’s low, which established another very high quality flag support trendline there, in this case a bull flag falling wedge.
These are two very good examples, but there are others, and on the six stocks and eleven ETFs covered in our FAANG stocks and Market ETFs Service at theartofchart.net, there is now a clear bias towards a low in this area, followed by bull flag breaks up into retests of the all time highs.
TSLA daily chart:
In my post of 6th August 2021 I was looking at the possibility that there would a retracement in the coming months to backtest the broken resistance trendline on SPX and then return to retest the highs, and I now think that having reached this area, the pattern setup now significantly favors a low here and then return to the high. While the market may of course go the other way, I think the odds here now are 60% or better that is the next serious move coming on SPX and NDX, with decent quality bull flags also on RUT and Dow. The more bullish scenario I laid out in that post is likely dead in the water, and it may be that the high retests are just to make the second highs on much larger double tops, but until we see some clear support breaks below this area, that is my main scenario here.
I might be mistaken, but I am also thinking that these retests of the all time highs on equities may well be supported by a big rally on bonds over the next few months. That sounds a bit radical here, but when I called a target on TNX at 32 at the end of last year that too sounded radical, and since then TNX has almost doubled into the recent high at 31.67. That may need to go a little higher, but I was thinking that we might see a big rally on bonds here to set up a right shoulder on a larger reversal pattern that would then take bonds much further and TNX up into the 60 area.
I’ll be doing a post on bonds and that and other possible bonds scenarios in the next week or so, but there are already decent buy signals in place on bonds that may deliver that rally.
In case you missed it in my last post, I’ll also mention our free to follow service ‘The Weekly Call’ at theartofchart.net. It is now up 714% since the start in October 2016 and Stan does a post every week on it at our blog. If you wanted to follow the trades you can do that automatically in a trading account at striker.com where it is in the top 10 of the trading strategies used there. I think this may be the best trading service given out for free on the internet, and if you try it and disagree, you can have a full no-quibble refund of that free subscription. 🙂


 16th May 2022