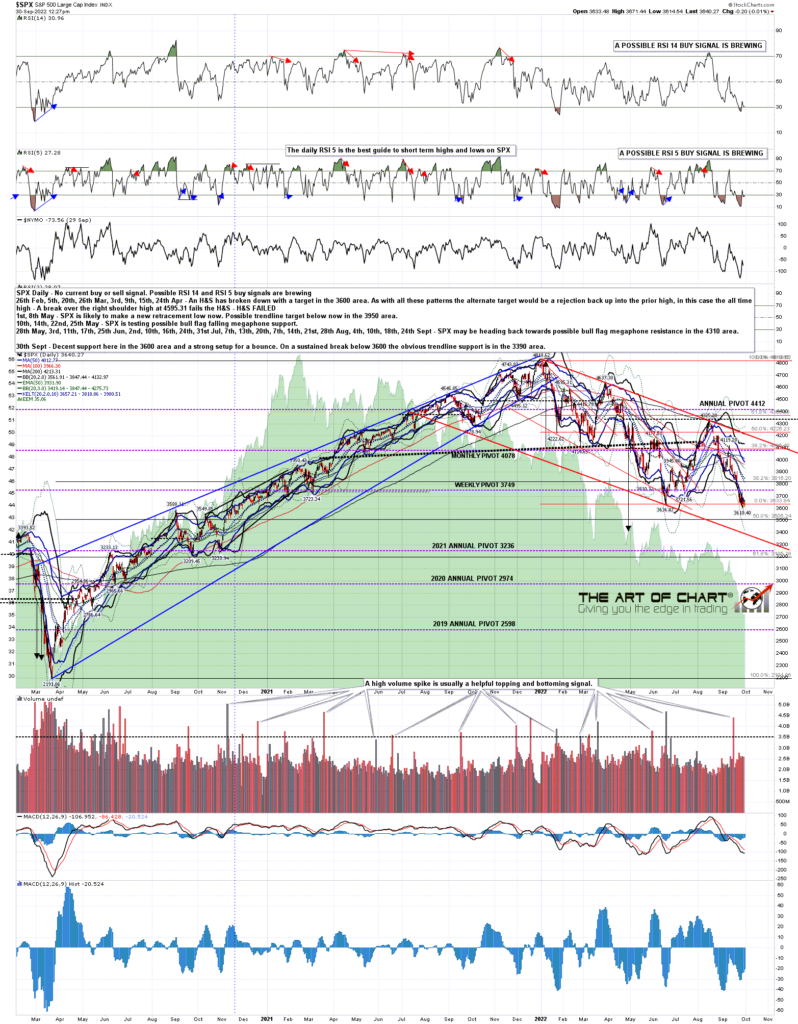
Last week I was looking for a new low on SPX for 2022 and we’ve seen that week. I was also wondering about a possible rally after that and SPX has been setting up nicely for that rally, even with news this week that has mainly been grim. Nonetheless it is a decent looking setup for a rally here, so I’ll have a look both at that and the obvious next target below in the event that this rally setup fails.
On the rally prospects side the new low and retest of that low has created a very decent quality potential double bottom setup that using the lows at the time of writing would look for the 3850 area on a sustained break over 3736.74. The retest has also set up positive divergence on the daily RSI 14 and RSI 5. Given that there is similar divergence on NDX and still an open hourly RSI 14 buy signal fixed, that is a lot of potential and actual support for a rally here.
On the downside, if SPX breaks and converts 3600 next then the next obvious target would be falling channel support, currently in the 3390 area. If seen, I’d be looking for a strong rally there.
SPX daily chart:
SPX hasn’t touched the daily lower band for three days, though each daily low hasn’t been far away so far. The daily lower band ride may well be ending and, if so, the obvious rally target would be the daily middle band. That is currently at 3847, currently a strong match with the possible double bottom setup here. The daily lower band is now at 3560, with the 3sd lower band now at 3417, so if we see a break down here, there is a now a lot of room to the downside.
SPX daily BBs chart:
If we are going to see a decent rally here on SPX then the next step would be a break over short term declining resistance now in the 3715 area. If seen the obvious next target for this rally would be declining resistance from the 4325 high. That is now in the 3950 area which looks a bit high, but that is a declining trendline of course.
SPX 15min chart:
I’m keeping an open mind on a rally here. The setup is nice but the news is grim and a strong enough trend will run over divergence and reversal setups. We’ll see soon enough whether that is the case here.
As of last weekend our Follow The Leader service at theartofchart.net was up 153% year to date with 90% winners so far. This is an autotrading service in partnership with GFF Brokers, official broker for the World Cup Advisor Auto Trade programs. This is included in our Daily Video Service and if you’re interested in that you can find out more about that here, and you can try a 30 day free trial at theartofchart.net here.
Our monthly free public webinar on Big Five and Key Sector ETFs at theartofchart.net was delayed a week so that is now after the close next Thursday and if you’d like to see that you can register for that here or on our October free webinars page.
My next post should be on Monday or Tuesday before the open. Everyone have a great weekend. 🙂


 30th Sep 2022