My last few posts have been a coronavirus COVID-19 series, so I’m putting in the links here so as to refer back to them easily for now. These are the five posts so far.
18th February – Peering Through The Fog Around Coronavirus COVID-19
24th February – Some Genuine Coronavirus Numbers Coming Through
28th February – Falling Down The Steps
9th March – A Tale Of Two Cities
Obviously it’s been an eventful few days and the world has been moving rapidly towards lockdown. If anything the news has run ahead of markets, which until the end of last week was looking more interesting than the news. Just to summarise the news over the weekend quickly:
- International travel has been extensively restricted, numerous national borders, universities, school, bars, cinemas & other meeting places closed
- The Fed cut interest rates to zero from the slightly more than zero that it has been over the last decade
- The Feb and Central Banks worldwide are co-coordinating massive new QE to minimise economic damage from the COVID-19 pandemic
One question raised frequently over past weeks is how this outbreak is any different to the normal influenza outbreaks seen every year, and that’s a good question that deserves a proper answer. I’m planning a post tomorrow or Wednesday morning answering that question.
In the meantime markets are still looking pretty interesting. In my post last Thursday I was noting at the end that with the support trendline at 2500 broken, then the obvious target was the big level in the 2350 area, with the H&S target and the December 2018 low both at 2346 and the rising support trendline from the 2009 low in the same area. That is a very big level which we kinda hit in the first hour this morning. It was an interesting journey to get there that says something about the kind of violent but still technical markets we are seeing here at the moment.
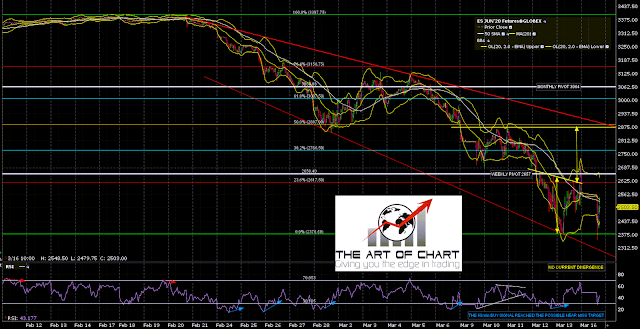
In my premarket video for subscribers at theartofchart.net on Friday morning, which you can see here, I was saying that the obvious path for Friday on ES (March) was first a test of the 2630 area or a bit higher (AM high was 2635 area), then a decline (more likely) to retest the overnight low at 2392 and maybe test the 2350 support area or (less likely) find support in the 2490-2500 area, making the right shoulder on an IHS that could then break up towards a higher target in the 2850-2950 area. Obviously the low was in the 2490 area and ES then broke up from that IHS with a target in the 2885 area.
That was a nice looking setup and on our regular Sunday Chart Chat for subscribers I was saying that there were two obvious paths from Friday’s close. These were either to head up to the IHS target, the more attractive as it was a 50% retracement of the move from the high, and close to declining resistance. The other option was a rejection back into the previous low at 2392 and once again very likely a test of the target and support area in the 2350 area, very possibly to make the second low of a larger double bottom for the rally that we should see sometime soon. Again, I was looking at that in my premarket video this morning shown below:
My premarket video at theartofchart.net from this morning:
Once again ES took the second option, the Thursday night low was retested and ES (now June contract) tested 2350 and found support there so far, though that may need a retest even if that will hold as support. Friday’s high at 2697 is now possible double bottom resistance.
ES Jun 60min:
So far, so predictable. However there are a few unexpected kinks in this market. The most interesting one this morning was that with the ES June low at 2350 this morning, the SPX low should have been in the 2365-70 area, but instead the SPX low was was 2401.57. The distance between ES has been getting rather variable on the harder market moves. This means that while the 2350 target area has been sort of tested this morning, the H&S target at the Dec 2018 low at 2346 SPX has not yet been reached, and rising support from the 2009 low has not yet been tested. Both of those may well need to be tested on SPX before we can start the possible serious rally that we could see from there.
SPX daily chart:
SPX monthly chart:
So why should we see a serious rally soon? Just because we are due another soon, and markets rarely go anywhere directly. In a bear market there are declines, retracements, and the declines are part of larger declines, that in turn have larger retracements. We should see one of those soon, and the test of major support in the 2350 area would be a good place to see that, though it might be from lower. We’ll see.
This has been a very interesting and surprisingly predictable market to trade. If you’d like to see some of this analysis before the market moves you can get free access to that for a month just by signing up for a 30 day free trial at theartofchart.net on this page here. That gives you access to most of our analysis and particularly our subscriber only twitter feed where we post our intraday updates and targets. The trial is free for 30 days, at the end of which you can either cancel with no obligation or subscribe to one of our services.


 16th Mar 2020