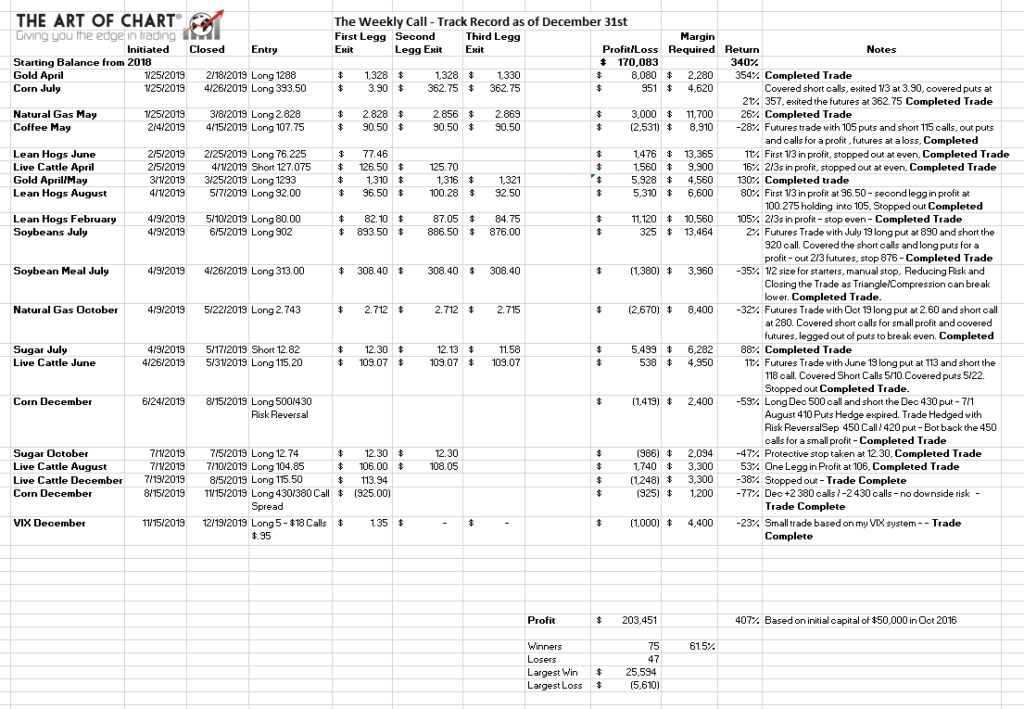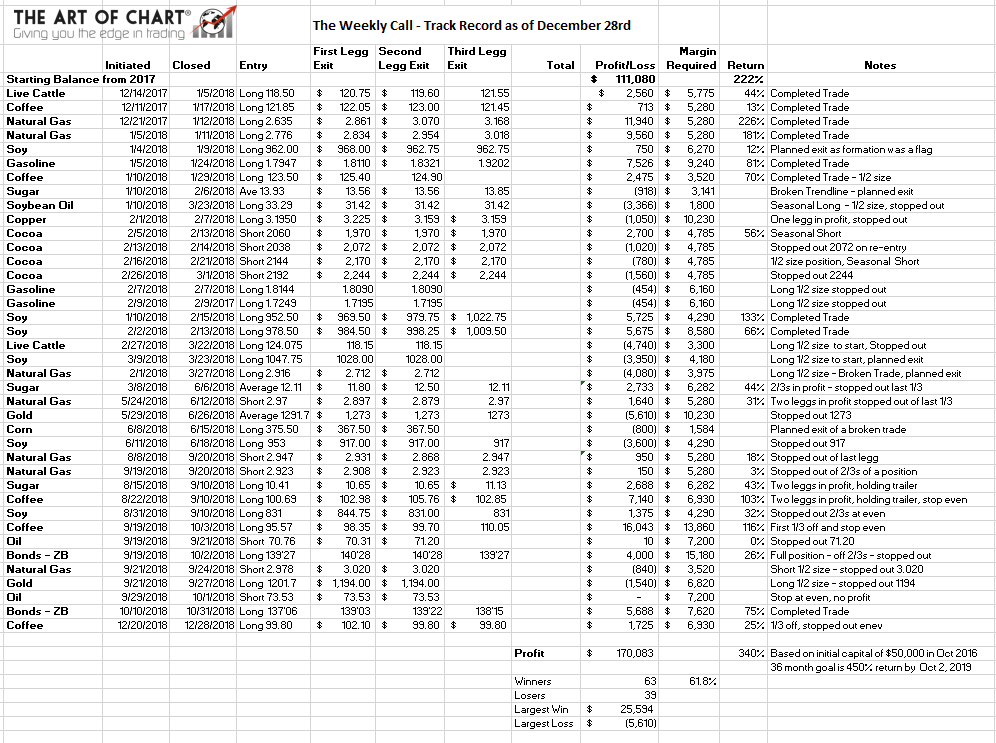
Welcome to this week’s edition of The Weekly Call, your trusted source for high-quality commodity setups and trading strategies. Since October 2016, our approach has delivered an impressive 777% return, and we continue to share the insights and methodologies that drive these results with this post #532. This week, we’ll explore the latest market trends, actionable trade setups, and global economic factors influencing commodities like sugar, coffee, live cattle, and gold.
Market prices reflect Friday, October 30 closing levels. Weekly changes are measured against October 23. Cryptocurrency prices reflect the October 30 historical snapshot.
U.S. markets finished October with another difficult week for technology stocks. The S&P 500 declined 0.57%, the Nasdaq lost 2.0%, and the Dow fell 0.85%. However, the Russell 2000 gained 1.29%, demonstrating improving participation outside the largest technology companies.
The Federal Reserve held interest rates unchanged, while third-quarter GDP increased a stronger-than-expected 3.4%. Inflation remains elevated, and investors are increasingly questioning whether the enormous investments in artificial intelligence will generate sufficient returns.
The key investment theme remains AI infrastructure, but the opportunity is shifting toward established suppliers with strong balance sheets and sustainable cash flow.
U.S. Markets
S&P 500: 7,580.07 — down 0.57%
The index experienced its worst session since June on Friday, declining 1.82%. Technology weakness contributed heavily to the decline. I am watching 7,500 for support and 7,700–7,800 for recovery.
Nasdaq Composite: 25,437.00 — down 2.00%
Technology stocks led the selling as investors questioned AI investment economics. Alphabet declined sharply after earnings, while Intel lost nearly 29% Friday following disappointing guidance.
The technology correction continues to distinguish financially strong companies from those dependent on aggressive growth expectations.
Dow Jones Industrial Average: 51,770.31 — down 0.85%
The Dow outperformed the Nasdaq as investors favored more established businesses and defensive sectors.
Russell 2000: 2,811.84 — up 1.29%
Small-cap stocks finished higher despite Friday’s decline. The equal-weight S&P 500 also gained approximately 0.8%, suggesting improving market participation beyond mega-cap technology.
10-Year Treasury Yield: approximately 4.93%
Treasury yields declined as investors sought safer assets.
VIX: 19.42
Volatility remains elevated but was relatively stable over the week.
Global Markets
FTSE 100: 10,729.78 — up approximately 0.37%
DAX: 25,818.21 — up approximately 2.5%
Nikkei 225: 63,290.11 — up approximately 1.0%
Shanghai Composite: 3,599.02 — down approximately 2.5%
European markets generally outperformed U.S. technology stocks. Japan recovered modestly, while Chinese equities remained weak.
These differences reinforce the importance of diversification and selective investing.
Commodities Snapshot
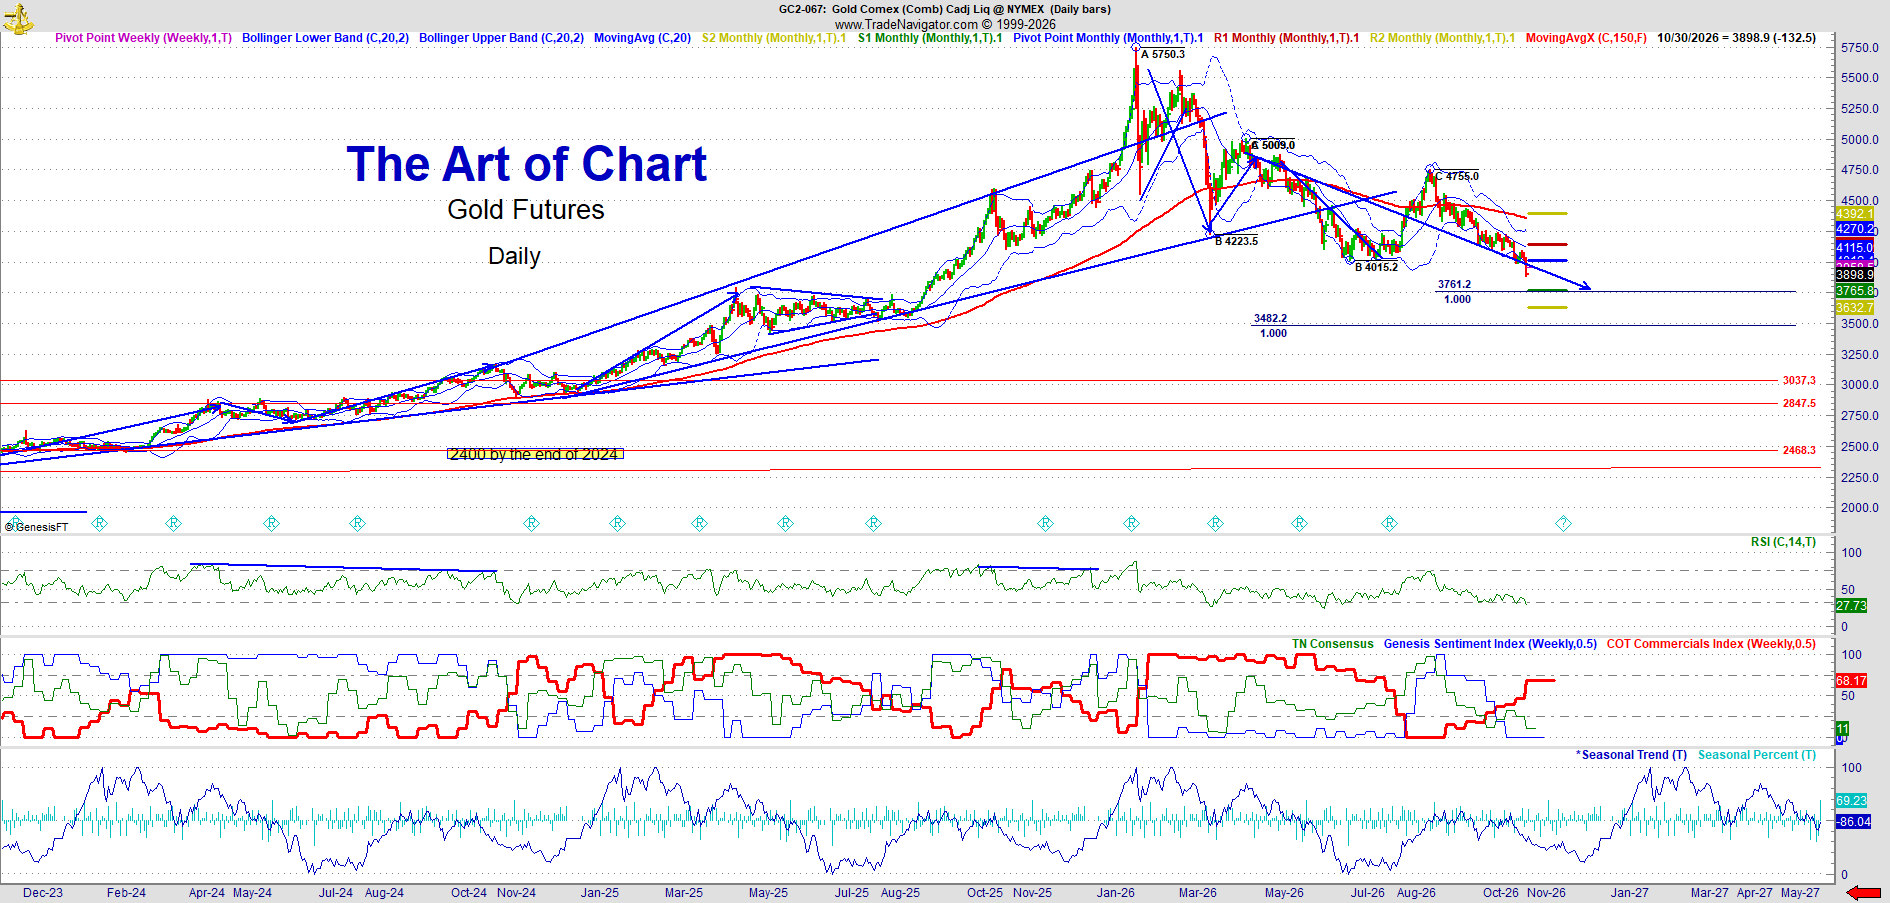
Gold: $3,884.90 per ounce — December futures
Gold declined sharply Friday. I am watching $3,800 for support and $4,000 for recovery.
Silver: approximately $49 per ounce — spot
Silver fell below $50 amid weakness in precious metals and industrial demand expectations.
Copper: approximately $6.58 per pound
Copper remained comparatively resilient. Long-term demand from electrical infrastructure, AI data centers, grid expansion, and industrial electrification continues to support the investment thesis.
WTI Crude Oil: $104.12 per barrel — January 2027 futures
Brent Crude Oil: $117.64 per barrel — expiring December 2026 futures
Oil prices remain elevated as geopolitical tensions and supply disruptions continue. Higher energy costs present additional inflation risks.
Natural Gas: approximately $2.90 per MMBtu — December futures
Natural gas prices remained relatively subdued, with weather, storage, and LNG demand influencing the outlook.
Cryptocurrency Market
Cryptocurrency markets weakened as institutional investment flows turned negative and technology shares experienced renewed selling.
| Cryptocurrency | Price | 7-Day Change |
|---|---|---|
| Bitcoin (BTC) | $77,198.21 | -4.78% |
| Ethereum (ETH) | $2,241.05 | -6.00% |
| Solana (SOL) | $96.22 | -6.38% |
| XRP | $1.2544 | -3.06% |
| BNB | $703.35 | -4.80% |
| Cardano (ADA) | $0.1951 | -7.29% |
| Dogecoin (DOGE) | $0.07588 | -3.38% |
| Hyperliquid (HYPE) | $90.08 | +16.98% |
Bitcoin declined below $80,000, while Ethereum and Solana experienced larger losses. Hyperliquid was a notable exception, gaining nearly 17%.
Institutional ETF outflows intensified Friday, reinforcing near-term caution.
However, traditional financial institutions continue expanding digital asset services, stablecoin payments, and tokenized securities.
Key Market Drivers
1. AI investment comes under greater scrutiny
Major technology companies continue committing enormous amounts of capital to AI infrastructure. Investors are increasingly demanding evidence that the spending can generate sufficient earnings and free cash flow.
The strongest opportunities may shift toward electrical equipment, cooling, networking, grid infrastructure, and power generation.
2. Federal Reserve holds interest rates
The Fed maintained its target range at 3.75%–4.00% on October 28. Two policymakers favored an increase, reinforcing concerns about persistent inflation.
3. Economic growth remains strong
Third-quarter GDP increased 3.4%, accelerating from 2.2% in the second quarter.
Consumer spending and business investment, particularly in AI-related equipment, contributed to growth.
4. Inflation remains elevated
September headline PCE inflation increased approximately 3.6% annually, while core PCE reached 3.1%.
Inflation remains above the Federal Reserve’s 2% target and could limit future monetary easing.
5. Energy prices remain a significant risk
Crude oil prices remain above $100, reflecting geopolitical tensions and supply concerns.
Higher transportation and energy costs could pressure consumers and corporate profitability.
6. Market participation is improving outside technology
Small-cap stocks and the equal-weight S&P 500 outperformed the major capitalization-weighted indexes.
This suggests investors are rotating toward sectors with more reasonable valuations and stronger near-term earnings visibility.
7. Employment becomes the next major catalyst
The November 6 employment report will provide important information about labor-market conditions and future interest-rate expectations.
Stronger employment could support economic confidence but also increase pressure on the Fed to maintain restrictive policy.
Emerging Crypto Projects & Ecosystem News
Coinbase adds Ripple’s RLUSD stablecoin
Coinbase expanded its stablecoin offerings by introducing RLUSD to its retail and institutional platforms, increasing competition in blockchain payments.
Kraken’s xStocks exceeds $1 billion
Payward announced that its tokenized securities platform surpassed $1 billion in assets under management, demonstrating growing demand for blockchain-based financial products.
Institutional blockchain infrastructure expands
CF Benchmarks introduced new on-chain benchmark services, supporting institutional pricing and settlement applications.
Stablecoin payment services continue growing
Reap expanded stablecoin card infrastructure to Monad, reinforcing the development of blockchain payments.
Institutional adoption remains constructive even as cryptocurrency prices experience volatility.
Outlook for the Week Ahead
Monday, November 2
October ISM Manufacturing Index and September construction spending. Apple earnings are also in focus.
Tuesday, November 3
September factory orders, durable goods data, and JOLTS job openings.
Wednesday, November 4
October ADP employment report, September trade balance, and ISM Services Index.
Thursday, November 5
Third-quarter productivity and labor-cost data. Bank of England interest-rate decision.
Friday, November 6
October employment report — 8:30 a.m. Eastern.
Preliminary November consumer sentiment — 10:00 a.m. Eastern.
What I Am Watching: Employment, services activity, and corporate earnings will help determine whether the market’s technology correction continues or creates selective buying opportunities.
Key Levels to Watch
| Market | Current Level | Upside Reference | Downside Reference |
|---|---|---|---|
| S&P 500 | 7,580 | 7,700 / 7,800 | 7,500 / 7,400 |
| Nasdaq | 25,437 | 26,000 / 26,500 | 25,000 / 24,500 |
| Dow Jones | 51,770 | 52,500 / 53,000 | 51,000 / 50,500 |
| Gold | $3,885 | $4,000 / $4,100 | $3,800 / $3,700 |
| Silver | ~$49 | $52 / $55 | $47 / $45 |
| WTI Crude | $104.12 | $105 / $110 | $100 / $95 |
| Bitcoin | $77,198 | $80,000 / $85,000 | $75,000 / $72,000 |
| Ethereum | $2,241 | $2,400 / $2,500 | $2,200 / $2,000 |
| Solana | $96.22 | $105 / $115 | $90 / $85 |
These are price-monitoring reference levels rather than guaranteed technical support or resistance.
As always, stay informed and adjust your strategies based on the evolving market conditions. All trades are posted on our Private Twitter Feed for subscribers and are included in the track record posted below under Completed Trades. I am currently trading 15 lots given the account balance and will adjust as necessary based on market developments.
Trading futures contracts and commodity options involves substantial risk of loss, and may not be appropriate for all investors. Past performance is no guarantee of future results. Please see our Disclaimer for more information.
The trades below are discussed on the Daily Update: – Click Here for a FREE Trial
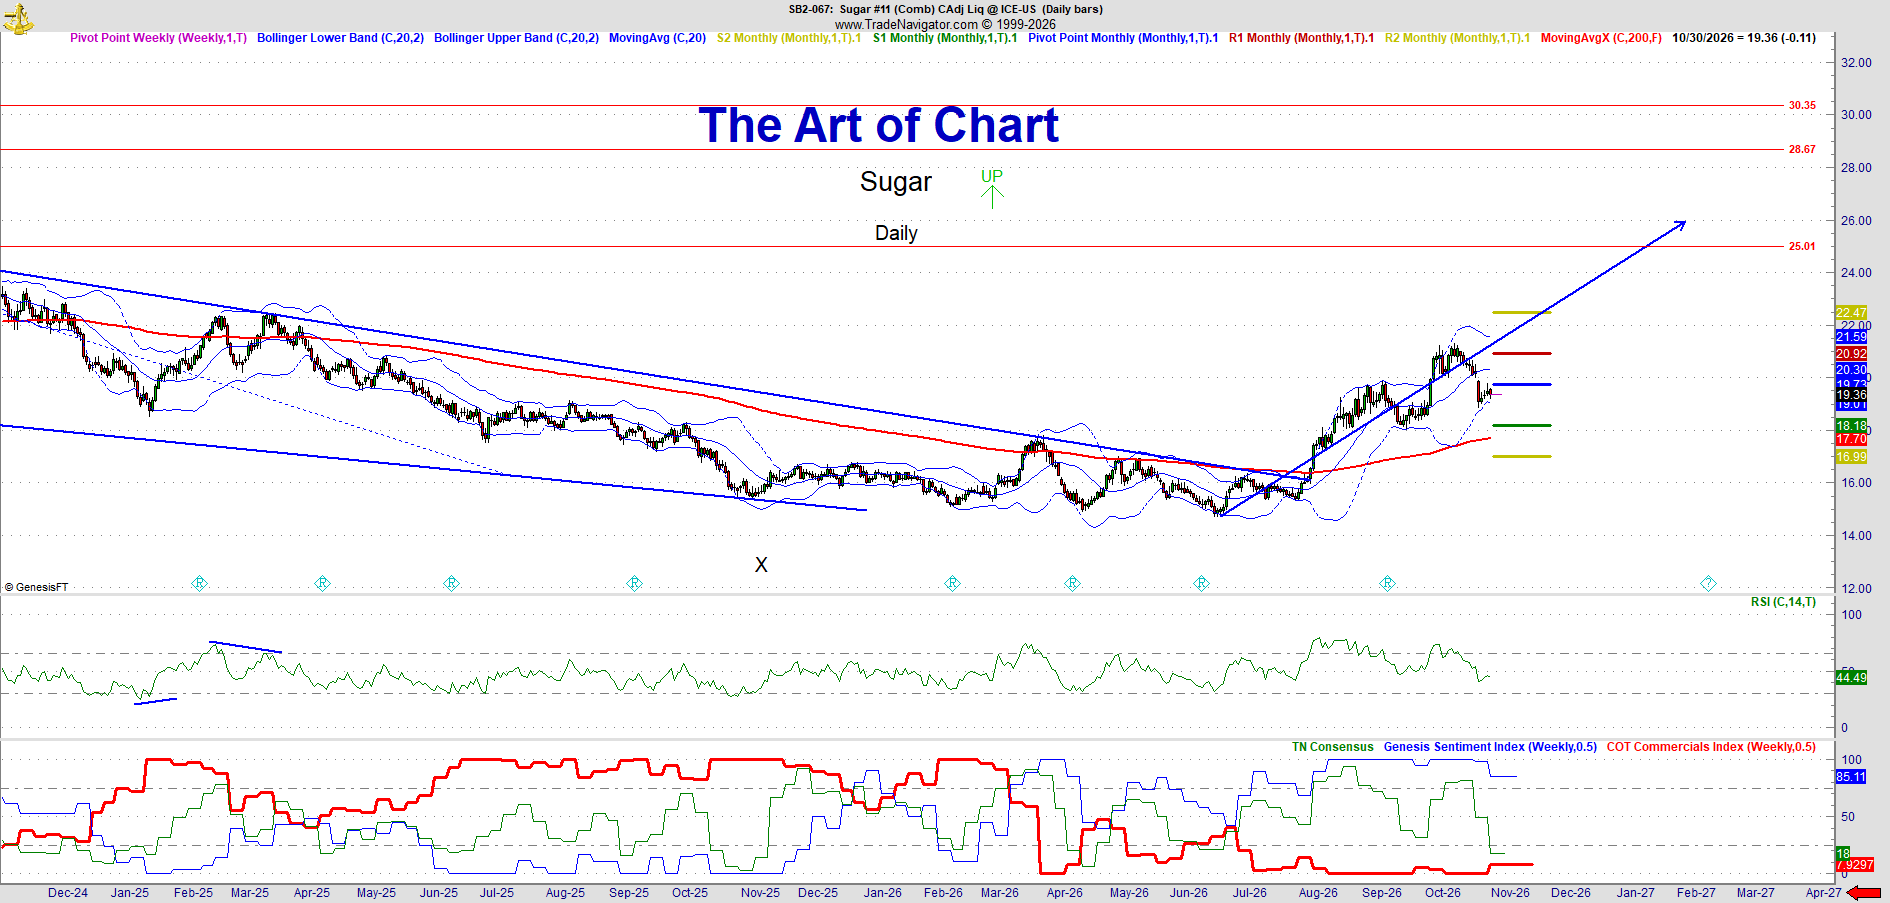
Sugar
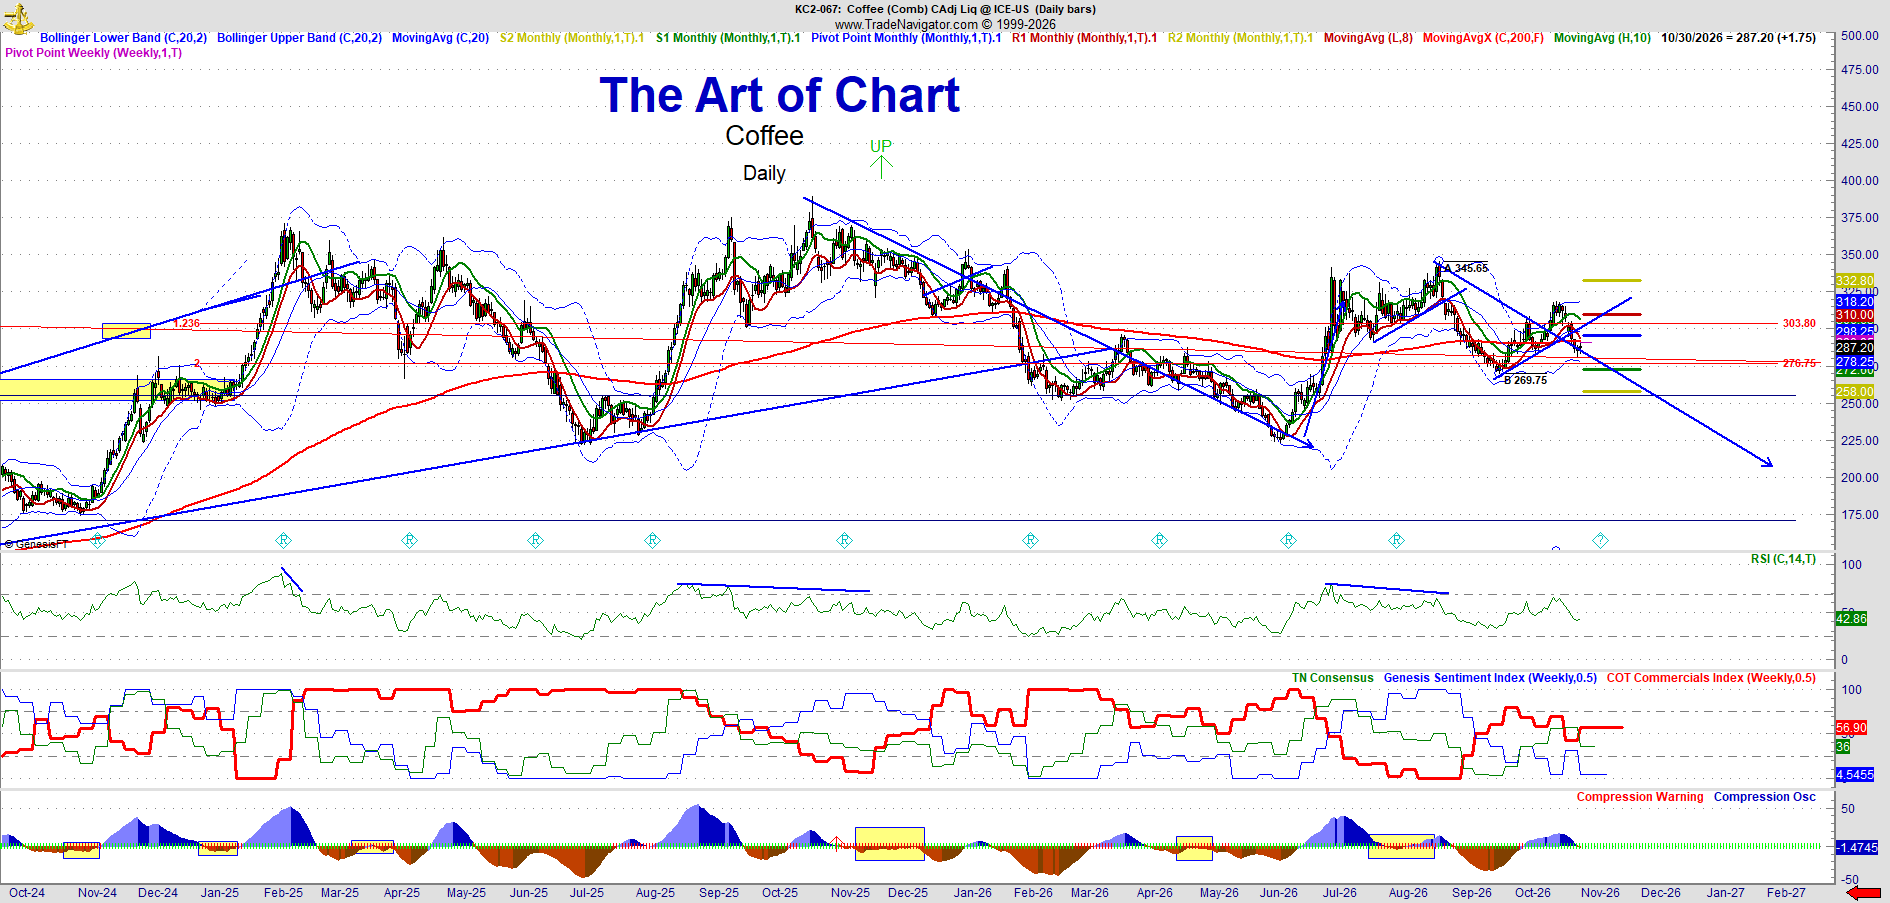
Coffee
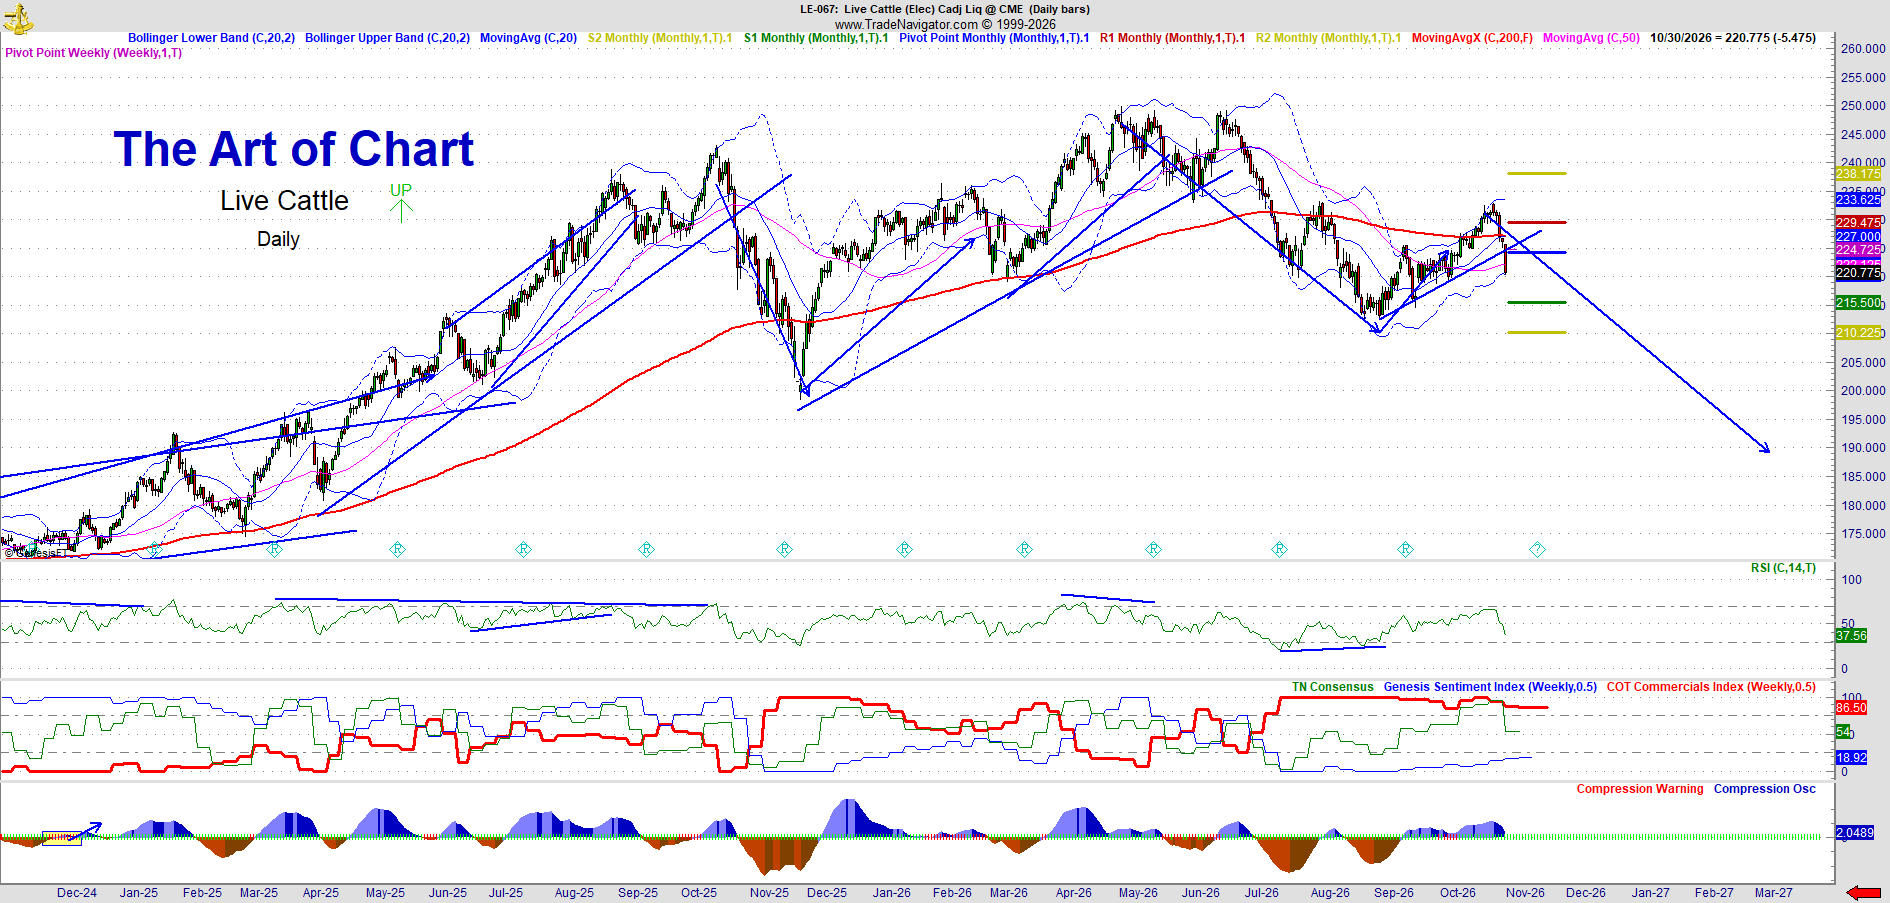
Live Cattle
Gold (GC)
Come see what we are trading – Try our 30 day FREE trial – Click Here
COMPLETED TRADES
Track Record of Completed Trades
The purpose of this blog is to demonstrate how to swing trade futures using our methodology to select high-quality setups and manage the trade with our risk management approach. This track record is based on entries and exits as posted in this blog. I am currently using 15 lots for the Striker trades which is based on this account being over $375,000. Each lot for auto trading at Striker requires $25,000 per lot. See the videos below for more information.
Track Record January 2022 thru December 2022 Click Here.
Track Record January 2021 thru December 2021 Click Here.
Track Record January 2020 thru December 2020 Click Here.
Track Record January 2019 thru December 2019 Click Here.
Track Record January 2018 thru December 2018 Click Here.
Track Record October 2016 – December 2017 Click Here.
*** Trading futures contracts and futures options involves substantial risk of loss, and may not be appropriate for all investors. By reading this web site, you acknowledge and accept that all trading decisions are your sole responsibility. Trading strategies referenced on this web site and associated documents and emails are only suggestions, no representation is being made that they will achieve profits or losses. Past performance is no guarantee of future results.. See our disclaimer here.
Completed trade in Cattle as of November 28th
We expect subscribers to have captured 60% of the swing in live cattle which is over $14,500 in profit using a margin of only $5,115. A great example of using leverage in futures.
Completed Trade in Coffee as of December 12th
The total swing was $37.00 and we expect subscribers to have captured 60% of a wing or $22 in coffee for a profit of over $25,500 using a margin of $8,850. A great example of using leverage in futures. See the video below for the review of the trade.
Completed Trade in Natural Gas as of January 2nd
We were stopped out of out last 1/3 position as weather-related news created a gap down on January 2nd and a possible flat with support at 3.196. This concludes our trade with natural gas; we exit with 550 ticks on 2/3s of a position with $8,500 in profit.
Completed Trade in Coffee as of January 19th
We exited the coffee trade on January 19th with $17 or over $15,000 in profit using a margin of $8,850. A great example of using leverage in futures.
Completed Trade in Gold as of February 8th
We exited the gold trade on February 8th with over $14,000 in profit. We entered on January 3rd and held the trade into the high window. We will re-enter gold in a few weeks after a backtest.
 01st Nov 2026